Are you writing something about the massive federal deficit? Do you want a hot blogging tip? Here you go: Put a chart on it!
I can explain the magnitude of the federal debt pretty easily: The recession caused revenue to plummet, and tax rates have been very low for years. Plus wars. But I explained that with words. Who reads words? No one, unless those words have lines next to them, or colored bars.
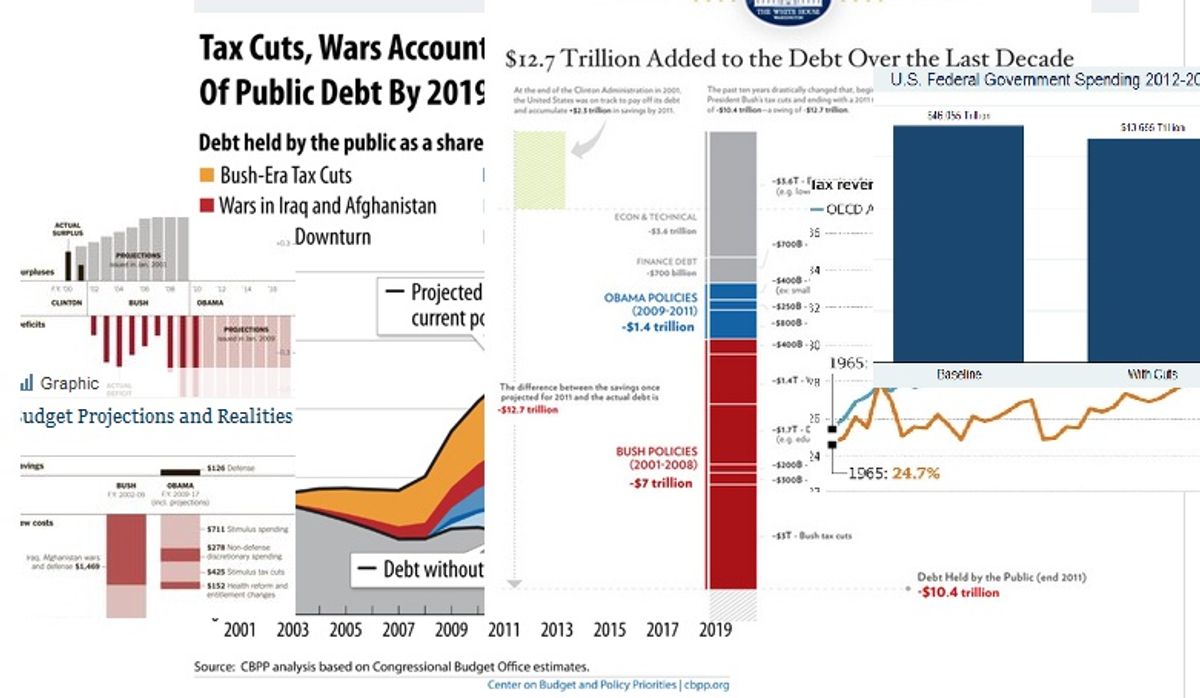
The New York Times made a chart blaming Bush for the debt, and it was so popular that it made another one that added a line explaining whom we owe the debt to. (Ourselves, mostly.) The White House made a chart that was basically the New York Times chart but with Bush's additions to the debt in red, for Republicanness. (Though a lot of it was gray, for "no one's fault, really, debt just happens.")
This chart was controversial! Megan McArdle said it was a bad chart and she made her own, different charts, that were much less effective in clearly communicating a complex idea simply. But basically she is all, don't blame Bush, because the deficit is bigger now, under Obama, and then Jon Chait was like, yes, the deficit is bigger under Obama because of Bush policies plus massive recession, duh.
Then the Toronto Globe and Mail made a chart making fun of Americans for worrying about the debt while paying less in taxes than every other developed nation besides Mexico and Chile. (We're No. 3!) This was accompanied by a chart showing how all these other countries make a lot of money from their taxes. Then James Fallows posted another chart, from Calculated Risk, showing that we have lost a lot of jobs and are not really getting those jobs back.
Nancy Pelosi made a chart that Politifact didn't like. The Daily Caller didn't like all these charts that correctly laid the blame for the deficit on Bush's policies, so it had a former OMB deputy director make a chart blaming Obama (primarily for ... continuing Bush-era policies). In this chart, Obama is red, and Bush is blue. Those Caller guys play by their own rules!
Mint.com made this huge infographic full of bloggy fake-nice "good design" that actually ends up being not a very good way of conveying all the information the infographic is supposed to be elegantly presenting. (The double-pyramid thing with the squiggly downward-trending line is just an illustration, right? Not actually representative of actual data?)
All of these followed on the heels of the classic chart that showed how the debt would be less without expensive things like wars and tax cuts. This chart, from the Center on Budget and Policy Priorities, comes in both debt and deficit versions. And there are hundreds more!
I've made this chart illustrating the recent explosion in charts designed to explain the causes and size of the federal deficit:

This is the one essential chart every debate over deficit charts should include.
Shares