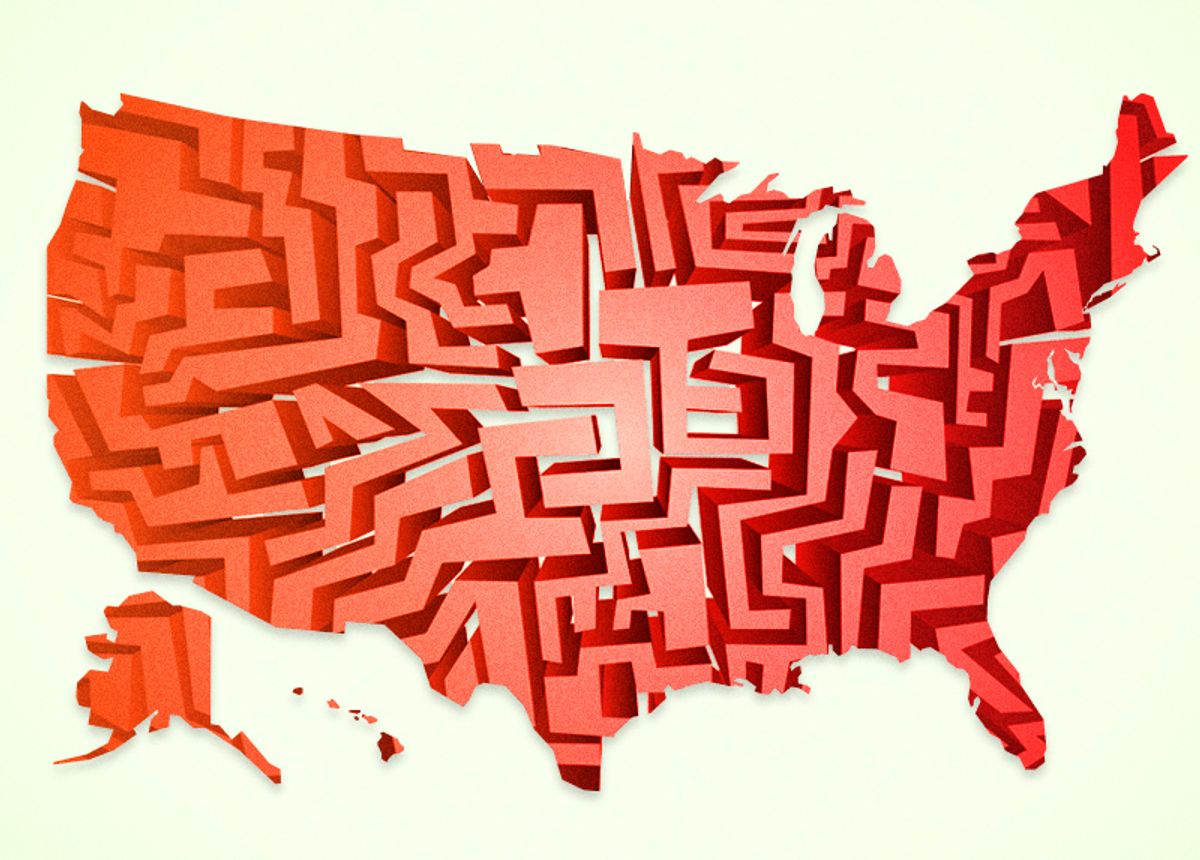
For nearly as long as the Unites States has existed there have been partisan hacks trying to draw up voting districts in a way that gives one political party an unfair advantage over the other. Though judges acknowledge that this partisan gerrymandering occurs, and that it can be unconstitutional, there’s hasn't yet been a definitive way for them to decide whether a district has been egregiously engineered to politically neuter voters of an opposing party.
Indeed, as recently as 2004, the U.S. Supreme Court acknowledged that measuring how much political influence on redistricting is too much is an “unanswerable question.”
But thanks to the power of algorithms and the latest supercomputing powers, new methods are arising that can help answer this unanswerable question. These methods played a role in November in convincing a three-judge panel to invalidate Wisconsin’s district assembly maps. The U.S. Supreme Court is expected to issue a final ruling this fall, and if the decision is upheld it would be a victory for political and social scientists, and it may finally give judges reliable methodologies to help decide if voting districts have been unfairly drawn.
“For a long time the courts have been talking about lacking the tools to measure the things that they’ve been asking to be measured,” Wendy K. Tam Cho, a political scientist and statistician at the University of Illinois, Urbana-Champaign, told Salon. “We’re taking technology and bringing it to this problem.”
Cho and her colleagues, computer engineer Yan Liu and geographer Shaowen Wang, are among researchers who are developing quantitative tools like the ones that helped show the alleged biases in Wisconsin’s electoral maps, which gave Republicans a majority in the state Assembly despite Democrats winning the majority of the popular vote in 2012 and 2014.
Using a complex algorithm and the power of 100,000 computer processors, Cho’s team can draw up millions or even a billion different versions of a statewide legislative or congressional district maps in just a couple of hours that can help identify if an existing district map shows evidence that it was drawn up to give an unfair advantage to a particular party.
While it’s popular to assume a weirdly drawn voting district is itself evidence of partisan gerrymandering, there can be legitimate reasons for why a district could have an odd shape. Some states require districts to follow natural boundaries like rivers and county lines. All states have laws that require equal populations among legislative districts and most require the same for congressional districts. Many states also have “compactness” rules in which districts need to have a compact geometric shape, which is easier in areas with denser populations. In sparely populated areas districts might need to be drawn in wild shapes to include enough people to comply with the equal-population rules. Adding to the difficulties of determining if a voting district was drawn to favor one party is that each state can more or less create its own rules for state legislative and congressional districts. And the federal Voting Rights Act also requires districts to fairly represent minority groups, which can lead to odd shapes, especially at the state legislative level. In other words, the odd shape of a voting district isn’t enough to prove partisan meddling.
The high powered computational model developed by Cho’s team can be programmed to rapidly draw district maps based on different criteria — such as equal population, keeping cities from being divided, and how many Republicans and Democrats reside in each district — to help sift through the many different reasons a district map is drawn a certain way.
Cho offered an example of a hypothetical 13 congressional districts in a state where 10 are heavily Republican. Using her algorithm and powerful computing processing, a researcher could define different criteria and then rapidly draw an enormous number of different versions of the statewide congressional district map. By drawing some of these maps by excluding data on the number of Democrats or Republicans in a district, these results could be compared to identify maps that had been drawn up to heavily favor one party, which could then be used as evidence in court challenges.
But the key to accuracy is being able to draw millions, or preferably billions, of different versions of a statewide district map. And that can only be done with recent technology.
“People have thought about doing this and people have tried to do it, but they have been unable to do it because it’s too big of a computing problem,” Cho said. “You’ve had people say they’ve drawn 1,000 maps or even 10,000 maps, but that’s not enough to characterize what a map would look like, or should look like.”
New computational applications like this will be the topic of a 5-day “Geometry of Redistricting” workshop at Tufts University in August in which Cho’s work as well the work others will explore modern issues with gerrymandering, including racial gerrymandering, and how data analysis can be used to root out these injustices that undermine the democratic process.

Shares