The term climate change is often used interchangeably with global warming. But while overall global temperatures are warming, the effects of climate change are not limited to hotter temperatures. (In fact, some locations are forecasted to get cooler.) A historically destructive wildfire season plagued California, while heavy storms set July rainfall records on the east coast of the U.S. That’s not to mention 2018′s hurricane season. Understanding the underlying statistics can help explain why all the repercussions of climate change can look so different.
This past July was a key example of this kind of variability: record-setting highs across the globe were coupled with devastating extreme weather events like monsoons in India and flooding in South Carolina. Imagine climate as a bell curve, where the height on the curve indicates how often something occurs. Natural things often have this shape, called a normal distribution — examples include adult height, the dimensions of almonds, and proteins found in human blood are all roughly normally distributed. This means that more common values tend to be closer to the average (also called the mean), while much larger and much smaller values are less numerous. For example, the mean height for men is 5’9”, so it’s more likely for men to be between 5’6” and 6’0” tall than it is to meet someone who is 7’ tall.
The distance values tend to be from the average is called the variance. In distributions with a “flatter” shape, values far away from the average are more likely than in a traditional bell curve. Another way of saying that is that unlikely events are more common in flat distributions, or those with a large variance. For example, if we lived in a hypothetical world with a lot of 4’ and 7’ tall men, the variance of that population’s height would be much larger than the one we actually observe.
Because these curves are easy to understand and translate, climate scientists often use a normal distribution to visualize certain parts of the climate, like temperature, precipitation, and the carbon cycle. These models indicate that most days will have weather closer to average (think “normal” spring and fall weather), while extreme hot and extreme cold weather events happen less often. So, if the Earth is getting warmer, where do all of the recent natural disasters and extreme weather events fit into the picture?
Consider, for instance, the distribution of climate in Nashville, Tennessee — summers are hot, winters are cold, and the average yearly temperature is 59°F. Now, imagine if Nashville suddenly became as warm as Houston, Texas, where by comparison, summers and winters are hotter and the average yearly temperature is 69°F. While temperatures are increased, such a change would not necessarily impact its variance — meaning summers would still be comparatively hotter than winters. Figure 1 (below) visualizes what would happen in this new Nashville climate: There would be more hot weather, including more record hot weather, and far less cold weather than its current climate.
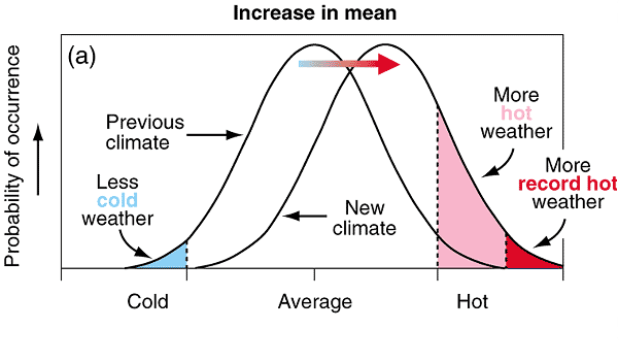
Figure 1: Schematic outlining the effect of an increased mean on the climate and subsequent weather patterns, from the IPCC (2001). COLEMAN HARRIS
Now, what happens if the average temperature stays the same, but the variance increases? Climate change, after all, doesn’t just increase temperatures, it increases the possibility of record-setting heat, cold, rain, and associated natural disasters. (Our current curve, in other words, gets much flatter.) Nashville, for example, is already one of the more variable cities in the United States, with average annual high temperatures of 70°F, and average annual low temperatures of 49°F, a difference of 21°F. This explains why Nashville has freezing winters that drop into the 20s and scorching summers that reach into the 90s. Compare this with a less variable place like that of San Diego, California, which is always warm, or Juneau, Alaska, which is always comparatively cold. Increasing variance, as shown in Figure 2 below, creates record hot and record cold weather into the climate — better pack both a jacket and swimsuit.
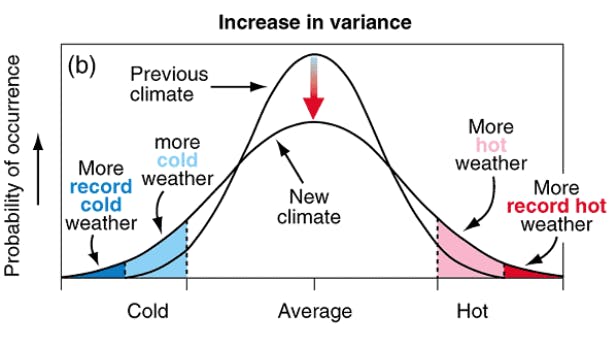
Figure 2: Schematic outlining the effect of an increased variance on the climate and subsequent weather patterns, from the IPCC (2001). COLEMAN HARRIS
So, what happens when we combine the two effects? There are not many real-world examples of this happening yet, but Figure 3 (below) shows what we have to look forward to. Average temperatures will get hotter, as well as having more record-breaking heat spikes, as well as far less cold weather. Looking at Nashville again, consider that hot weather would now occupy a much larger portion of Nashville’s bell curve—but temperature is only one factor in observable climate. There are dozens of systems impacted by climate change, such as precipitation, the carbon cycle, oceans, glaciers, and the atmosphere. Each of these has its own well-balanced distribution that is currently threatened by changes to the Earth’s climate. By changing the variance within each of these factors, the changing climate poses a serious threat through powerful natural disasters that have potential to impact millions.
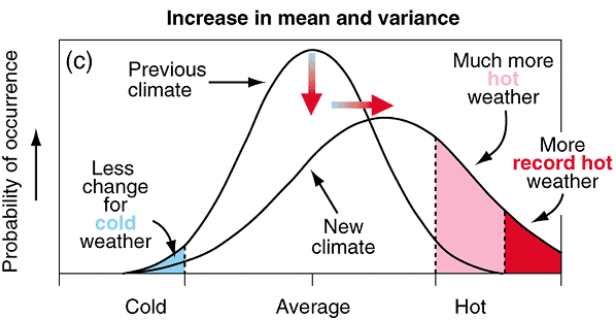
Figure 3: Schematic outlining the effect of an increased mean & increased variance on the climate and subsequent weather patterns, from the IPCC (2001). COLEMAN HARRIS
Increases to the mean and the variance have already impacted the world today, visible in our recent wildfires, flooding, and heatwaves. While each major disaster cannot be directly attributed to climate change, the increasing intensity and frequency of natural disasters isattributable to changes in the Earth’s climate. If measures are not enacted to curb climate change soon, Earth will continue on its path out of balance — resulting in potentially permanent damage to the planet and a climate distribution unfit for human life.
