Curious to know exactly what’s in the water that flows from your taps? Then simply plug your zip code into the latest iteration of the Environmental Working Group’s (EWG) Tap Water Database.
The database provides an analysis of the water springing from the nation’s faucets, with updated information pertaining to issues like the water quality impacts from agricultural runoff, lead contamination stemming from aging infrastructure, as well as the growing human health and environmental threats posed by Per- and Polyfluorinated Alkyl Substances, otherwise known as PFASs. As of October 2019, 1,026 sites in 49 states are known to be impacted by this potentially toxic family of chemical, according to the EWG.
The database also serves to highlight a glaring injustice inherent in U.S. drinking water systems: low-income communities are more likely than their wealthier neighbors to be served drinking water that is of poorer quality, with higher levels of potentially toxic contaminants.
“The relationship between social and economic indicators and water quality is well established,” Olga Naidenko, vice president of science investigations for EWG — an environmental health nonprofit — told Truthout. “Poor people always have the short end of the stick.”
The EWG database update published this week comprises drinking water results taken between 2012 and 2017 from nearly 50,000 local utilities in 50 states. The information included is more detailed than that found in Consumer Confidence Reports — an annual federally mandated report in which only the levels of regulated contaminants are required to be reported. By comparison, listed in the EWG database are 278 contaminants detected by local utilities, more than 160 of which have no federal standard. Even if a contaminant falls under state or federal regulations, the permitted thresholds may be at levels authoritative scientific studies have found to be potentially unsafe for humans.
At Truthout’s request, EWG researchers ran the numbers on the latest database to look at some of the ways in which the socioeconomic disparities in drinking water quality play out.
Looking specifically at arsenic, a known carcinogen, smaller drinking water systems tend to have higher arsenic levels in drinking water than larger water systems, the EWG told Truthout. Smaller water utilities, which commonly struggle with underfunding and aging systems, are more likely than their larger cousins to serve low-income, disadvantaged communities.
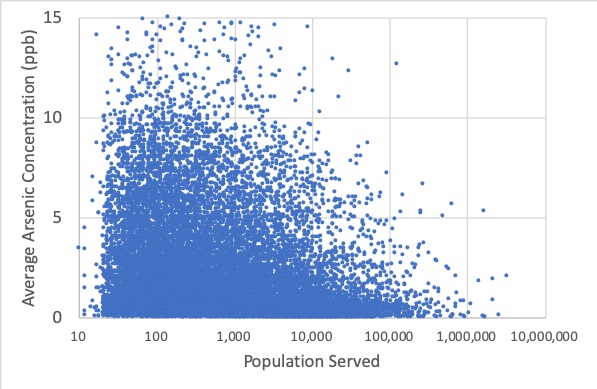
This scatter plot shows one point for each system in the analysis. Average arsenic concentrations were calculated for each system by averaging all sample data between 2010 and 2017 for each individual system. Credit: Environmental Working Group (EWG)
Looking at the bigger picture, while the list of contaminants tends to be similar in both smaller and larger systems, the levels of these contaminants differ, with higher levels found in smaller systems, according to EWG science analyst Sydney Evans. She added that, like arsenic, carcinogenic nitrates are typically discovered at higher concentrations in smaller systems as compared to larger ones.
Of the more than 150,000 operational public water systems in the U.S., 97 percent of them are considered small, meaning they serve 10,000 or fewer people. These small systems serve 21 percent of the population receiving drinking water from public water utilities.
Growing awareness of causes
The correlation between disadvantaged communities and poor drinking water quality is indeed well established, as Naidenko points out. Last year, for example, the National Academy of Sciences released a comprehensive report into national drinking water standards going back decades.
The National Academy of Sciences found that every year between 1982 and 2015, between 9 and 45 million people were served water that had violated federal health-based water quality standards. In 2015 alone, nearly 10 percent of community water systems serving nearly 21 million Americans had violated these standards. Tellingly, the report found that some of the most vulnerable populations were those from low-income rural areas, with parts of Oklahoma and West Texas among the worst community water system serial violators.
Those links between poor tap water and poor communities again came to the fore in the findings of another recent and comprehensive study, titled “Watered Down Justice,” put together by three environmental advocacy organizations: the Natural Resources Defense Council, Coming Clean and the Environmental Justice Health Alliance.
The report used Environmental Protection Agency (EPA) data from between 2016 and 2019. It found that socioeconomic indicators like race, ethnicity, language spoken and access to transportation had the strongest relationship to ineffective enforcement of the Safe Drinking Water Act, the nation’s signature drinking water law, and higher instances of serious violations.
Community water systems notorious for being serial violators were 40 percent more likely to be found in communities with higher percentages of people of color, the report found, while small systems were responsible for more than 80 percent of all violations. All told, nearly 130 million Americans were served drinking water that violated federal standards during the period reviewed in the report.
A well-established correlation? Sure. But it hasn’t always been an issue that has enjoyed much of a public airing. That said, recent high-profile events have helped to reshape the narrative, like the disaster in Flint, Michigan, where in early 2016, a federal emergency was declared after it came to light that a cost-cutting change in water source led to widespread high blood lead concentrations among those served. Currently, about 54 percent of Flint’s residents are African American —of those, 41 percent live below the poverty line.
Moreover, there is growing understanding of the underlying political, economic and cultural causes propping up this status quo, and more of the long-term human health implications are coming to light, as well.
The American Society of Civil Engineers already scores the nation’s infrastructure a miserable D+, while in its own 2016 report, the EPA admitted that aging and underfunded water infrastructure heavily contributes to issues of poor drinking water quality. Which water systems are least likely to receive the funding needed to produce safe drinking water? Those serving disadvantaged communities and people of color.
As to the potential long-term human health effects from living with poor drinking water, the “Watered Down Justice” report points to cancer, developmental, fertility and nervous system issues, along with gastrointestinal disease — problems that can pose the greatest threat to vulnerable members of the community, such as the elderly and people with chronic health problems.
In that respect, many experts are looking to California to lead the charge toward reform, thanks to the “Human Right to Water” bill signed into law back in 2012 by then-California Gov. Jerry Brown.
The human right to water
In essence, the law requires the state to enact policies so that “every human being has the right to safe, clean, affordable, and accessible water adequate for human consumption, cooking, and sanitary purposes,” as purported in the bill’s text. It’s the only such law in the nation.
“There’s a broad move to seeing water as a human right, not just as a service,” said Jonathan London, associate professor and director of the Center for Regional Change at the University of California, Davis, about the human right to water bill. “I think it’s a pretty appealing framework.”
That said, the bill is far from perfect.
Last year, London co-authored a reporton the struggle for water justice in the San Joaquin Valley, California’s farming heartland. The report found that approximately 1 in 9 of the region’s population — some 350,000 people — live in disadvantaged unincorporated communities, and these people are more likely to be served poorer drinking water than those living in incorporated communities. Indeed, nearly a quarter of the 155 community water systems serving disadvantaged unincorporated communities either fully or partially are out of compliance with federal drinking water requirements.
Interestingly, the report points to the consolidation of water systems — the merging of several entities into one — as one potential fix in the San Joaquin Valley, where 66 percent of residents of disadvantaged unincorporated communities live adjacent to a water system that does, or could, provide safe water given “proper investments” in infrastructure. In that regard, many view as a major boon a state law passed earlier this year aimed at closing the funding gap between large and small utilities.
“We’ve just got to make sure the funds are getting to the most underserved places, and that those places have the capacity to attract those funds and manage those funds,” said London, referencing another purpose of the bill: to funnel funds toward communities with no water systems or only partial coverage.
But a fundamental problem with the broader human right to water bill is that it doesn’t have an enforcement mechanism, said London. “It’s an aspirational goal, and a direction for agencies, but it doesn’t say anything about what happens if that right is not being protected,” he said.
Indeed, some environmental organizations have criticized as not going far enough certain measures the state has already taken to tackle drinking water inequality issues.
Harmful health effects even from low levels of contaminants
Some of the problems facing disadvantaged communities in California’s Central Valley are applicable nationwide — rural parts of the U.S. especially.
Looking at national drinking water data from 2010-2014, the Silent Spring Institute, a nonprofit scientific research institute, found that 5.6 million Americans were served water containing nitrate — a common contaminant found in agricultural runoff — at levels higher than 5 milligrams per liter (mg/L). Though the federal threshold for nitrate in drinking water is 10 mg/L, experts point to growing epidemiological evidence for health effects like cancers and birth problems associated with drinking water below that limit. Latinx communities were most vulnerable to higher nitrate levels, the study found.
“Studies show very harmful health effects even at low levels,” said Laurel Schaider, a research scientist with the institute. She highlighted practical changes farmers could make to mitigate the problem, like contour buffers, which help to block and trap agricultural run-off before it reaches nearby waterways. More broadly, the federal government could play a major part in improving drinking water quality, she said. No new chemicals, for example, have been added to the EPA’s list of primary drinking water contaminants in nearly 20 years.
As a result, federal standards desperately need to be updated to reflect the state of the nation’s drinking water, said Schaider. “These standards haven’t been revised for a long time.”
According to Naidenko, the EWG will, in the upcoming months, conduct further research into the link between poor communities and poor drinking water, using the data compiled in the latest database. It won’t be just an analytical enterprise.
“I am also really focusing on what kinds of solutions we can propose,” said Naidenko, referencing California’s human right to water bill, “which we consider a very important framework.”
Copyright © Truthout. Reprinted with permission.
