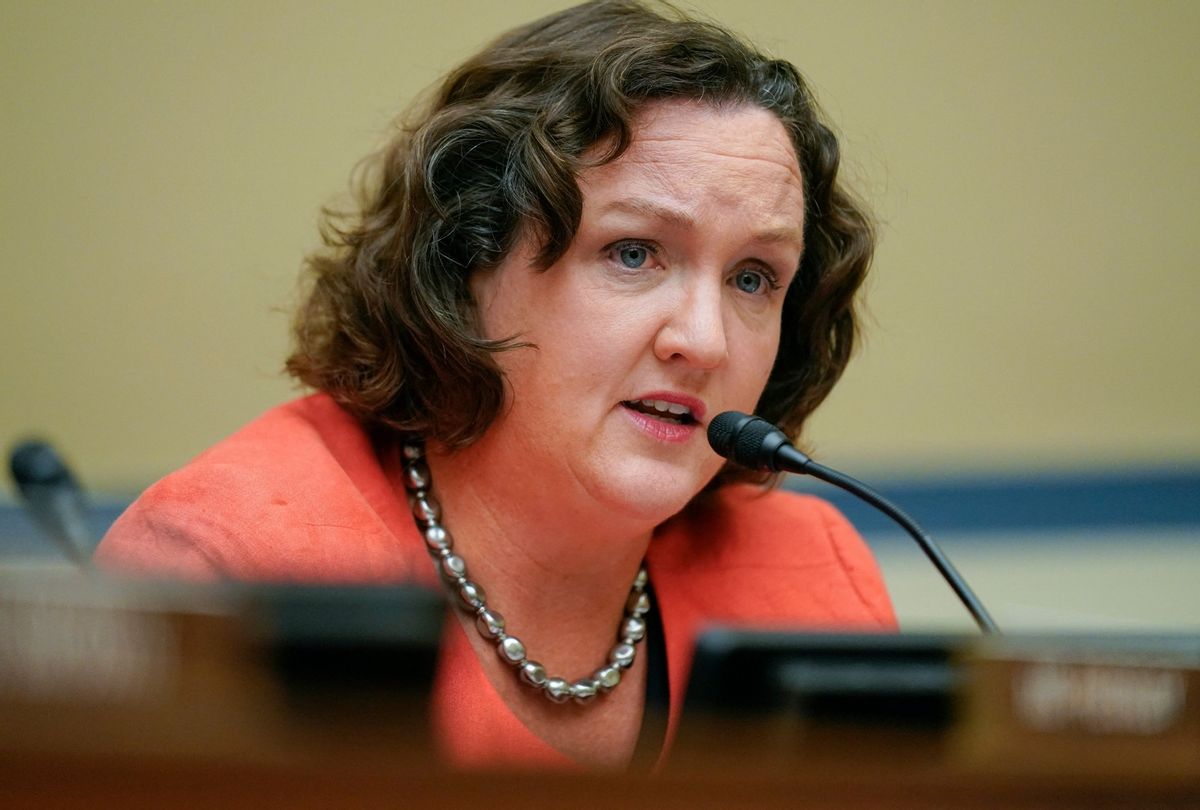
During a House of Representatives hearing on Wednesday, United States Congresswoman Katie Porter (D-California) grilled Mike Konczal, the director of Macroeconomic Analysis at the Roosevelt Institute, over the primary cause of inflation in the post-COVID-19 economy.
Equipped with one of her easy-to-read, data-filled posters, Porter got Konczal to admit that surging corporate profits are forcing American consumers to pay significantly more for goods and services.
"According to this chart, what is the biggest driver of inflation during the pandemic? The blue – the dark blue is the recent period," Porter pointed out.
READ MORE: Why the global inflationary tsunami is made in the United States and not Ukraine
"It would be corporate profits," Konczal confirmed.
"And what is that percentage?" Porter asked.
"It is 54 percent," Konczal replied, "and that number does stay that level of high if you update that number to more recent numbers as well."
Porter asked if that meant that "over half of the increased prices people are paying are coming from increases in corporate profits?"
READ MORE: 'The elephant in the room': Top Fed official says corporate price hikes are fueling inflation
Konczal said that it did and that "the unit price index is reflected in corporate profits as opposed to other costs."
Porter questioned Konczal, "how does that compare to, historically, other periods of inflation or over other periods of economic time?"
Konczal noted that "it is significantly higher in this recovery – 11.5 percent."
Porter added, "and what is it today?"
Konczal conceded that it is "53 percent."
Porter then had Konczal clarify what her graphic is representing:
So I want to make sure everyone in America understands this chart. What is a 'unit labor cost?'
Konczal:
The cost in wages and associated work.
Porter:
But we can just say wages. What is a 'non-labor input cost?'
Konczal:
A variety of things, including maintenance and investments.
Porter:
Okay, so I have to buy the stuff to make the widget. I have to have a factory. I have to keep the lights on. I have to hire someone to make the widget. That's this stuff. And this is what I add on, on top?
Konczal:
Yes.
Watch below or at this link.
Bigger corporate profits account for *over half* of the higher prices people are paying. pic.twitter.com/RZr5O0X4oJ
— Rep. Katie Porter (@RepKatiePorter) October 18, 2022


Shares