![]() We’re heading into the last week of a tight presidential campaign, and polls are coming in too fast to count. Partisans everywhere are desperate for omens. But at moments like these, it’s people who care most intensely that the “right outcome” occur who run a high risk of getting it wrong—picking out positive polls for comfort, or panicking over an unusual and unexpected result they don’t like.
We’re heading into the last week of a tight presidential campaign, and polls are coming in too fast to count. Partisans everywhere are desperate for omens. But at moments like these, it’s people who care most intensely that the “right outcome” occur who run a high risk of getting it wrong—picking out positive polls for comfort, or panicking over an unusual and unexpected result they don’t like.
Fortunately, our most prominent number cruncher has been giving us the straight story instead of capitalizing on this anxiety. In 2008, Nate Silver correctly predicted the results of all 35 Senate races and the presidential results in 49 out of 50 states. Since then, his website, fivethirtyeight.com (now central to The New York Times’s political coverage), has become an essential source of rigorous, objective analysis of voter surveys to predict the Electoral College outcome of presidential campaigns.
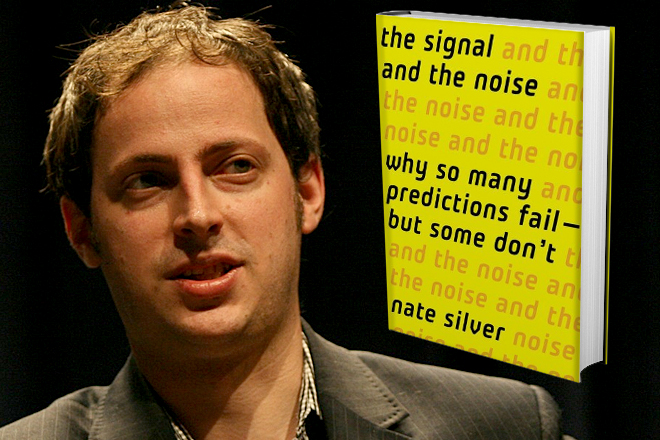
Publishers lined up to offer Silver a chance to write a blockbuster, and he could have cashed in on his success to sell false confidence, magic bullets, or a secret formula for predicting to beat the experts. Instead, he offers a much-needed reality check. Political junkies, activists, strategists, and journalists will gain a deeper and more sobering sense of Silver’s methods in The Signal and the Noise: Why So Many Predictions Fail—But Some Don’t (Penguin Press). A brilliant analysis of forecasting in finance, geology, politics, sports, weather, and other domains, Silver’s book is also an original fusion of cognitive psychology and modern statistical theory. Its most important message is that the first step toward improving our predictions is learning how to live with uncertainty. The second step is starting to understand why it is that big data, super computers, and mathematical sophistication haven’t made us better at separating signals (information with true predictive value) from noise (misleading information).
Silver’s backstory reads like a quirky screenplay. While working as a transfer pricing consultant who helped companies minimize tax exposure from overseas investments, he spent his evenings and weekends perfecting an ingenious computer system for evaluating baseball players’ stats, which outperformed the analyses of many experts. A company running an Internet site for Rotisserie League fans bought his system. Silver used the money to stake himself as a full-time online poker player, quickly earning $400,000. Shortly thereafter, congressional grandstanding before the 2006 midterm elections stifled the online poker business with regulations, leading the best professional players, deprived of the overconfident amateurs they had been feasting on, to go after players like Silver. He lost $130,000. So he turned to politics, attempting to predict the partisan composition of the next Congress to help him decide whether to cut his losses and move on from poker. Thus was born the sideline that became fivethirtyeight.com.
As The Signal and the Noise shows, Silver’s background in sports and poker turns out to be invaluable. Successful analysts in gambling and sports are different from fans and partisans—far more aware that “sure things” are likely to be illusions, or “sirens of overconfidence,” as Silver puts it. Here he blends the best of modern statistical analysis with research on cognition biases pioneered by Princeton psychologist and Nobel laureate in economics Daniel Kahneman and the late Stanford psychologist Amos Tversky.
One of the biggest problems we have in separating signal from noise is that when we look too hard for certainty that isn’t there, we often end up attracted to noise, either because it is more prominent or because it confirms what we would like to believe. This is a worse problem in politics than in baseball or poker. If most polls are reporting a tight race, an outlier showing a bigger gap will be the poll that makes news, thus getting more of our attention. Partisan TV pundits try to assuage the worries of the faithful on their side instead of making accurate predictions. When Silver analyzed 1,000 predictions on The McClaughlin Group, he found them no more accurate than flipping a coin.
After the second presidential debate, three national polls showed Mitt Romney ahead and three showed Barack Obama ahead. Soon enough, Gallup reported a seven-point Romney lead in its tracking poll. Obama supporters panicked. Silver pointed out that Gallup was one of five national tracking polls—polls that conduct interviews every day and report a result based upon the most recent four to seven days. The average of the five tracking polls was nearly a tie, and the average result in the other nine concurrent national surveys was a 0.2 percent Obama lead.
Besieged by Obama supporters, and attacked or dismissed by Romney supporters, Silver calmly collected all the news stories about that set of tracking polls in the Lexis database. The five tracking polls and nine regular polls were within one percentage point of a tie, yet the average result reported in newspaper stories about the polls was a four point Romney lead. Anomalous results like the Gallup poll are not unique to politics. In discipline after discipline, Silver shows in his book that when you look at even the best single forecast, the average of all independent forecasts is 15 to 20 percent more accurate.
* * *
Over the last twenty years, the proliferation of state and national polls has vastly improved forecasting. When I did the state-level tracking for the 1992 Clinton campaign, I saw that state polls moved in sync with the national polls. If the Clinton margin in a state was two points better than the national margin, it generally stayed about that much ahead of the national margin during the course of the campaign. Before I made that observation, Clinton strategist James Carville had dismissed the early polls as soufflés, since they rose and fell so fast. But now there was a way to compare state polls over time and as the national poll numbers moved around. If a poll had Clinton ahead by four in Iowa at the same time that he was tied in the national polls, then he was rated as “plus four” in Iowa. Later in the year, if Clinton was up by ten nationally and up by 12 in Maryland, he was “plus two” in Maryland—doing well, but not quite as strong as in Iowa.
This simple model was very useful for helping campaigns decide which states to buy media and plan visits in, especially compared with previous methods. But even then it used only a small amount of the available information. The major advances in prediction came when more sources of error started being taken into account, and the interrelationships between state and national polls got factored into predictions.
Starting in 2000, a pioneering website, RealClearPolitics.com, began averaging all the concurrent polls for the country and for each state so that an anomalous result would not be taken more seriously than other polls. As the number of state polls soared, Charles Franklin, writing for Mark Blumenthal’s Pollster.com (now Huffpost Pollster), started to analyze “house effects,” the propensity of some polling firms to regularly produce estimates more favorable to one party’s candidates.
Every poll contains some information, so the next breakthrough was finding a way to take all the information and all the sources of error into account. Using state polls and national polls at the same time requires abandoning the old-fashioned statistical approach of simply reporting each poll with a measure of confidence for its estimate, or merely averaging national polls or all the polls from the same state. Silver has taken the next major step: constantly incorporating both state polls and national polls into Bayesian models that also incorporate economic data.
Before this, Bayesian models had been used almost everywhere in research save traditional media polling. Bayesian models slowly whittle away wrongness and estimate how right we believe we are. They force us to ask how probable we believe something to be—say an Obama victory—before collecting new evidence and revising our level of uncertainty.
Silver explains why we will be misled if we only consider significance tests—i.e., statements that the margin of error for the results is, for example, plus or minus four points, meaning there is one chance in 20 that the percentages reported are off by more than four. Calculations like these assume the only source of error is sampling error—the irreducible error—while ignoring errors attributable to house effects, like the proportion of cell-phone users, one of the complex set of assumptions every pollster must make about who will actually vote. In other words, such an approach ignores context in order to avoid having to justify and defend judgments.
When Silver walks through his assumptions in every case study in his book, he is on a mission. Instead of pretending that everything is cut and dried, he considers the relative value of today’s state polls and yesterday’s national polls. Every new poll is evaluated in light of all the other polls. This avoids cherry-picking of polls that confirm our biases.
In his analysis of fascinating examples ranging across all the areas in which we try to predict future outcomes, Silver stresses the gap between what we claim to know and what we actually know. In 1997, the National Weather Service predicted that heavy winter snows would cause North Dakota’s Red River to flood over its banks in two months, cresting at 49 feet. The residents of Grand Forks were relieved, since their levees were designed to withstand a 51-foot crest. If the Weather Service had mentioned that the margin of error for its forecast was five feet, the three feet of water that poured over the levels in an eventual 54-foot crest might not have destroyed 75 percent of the town. Happily, the Weather Service now provides that information—an example of an easy reform to forecasting.
If only it were so easy to reform economic predictions. In 2007 the Wall Street Journal’s forecasting panel predicted a 38 percent chance of a recession in the coming year; the data now reveal we were already in recession. Economists in the Survey of Professional Forecasters gave a one in 500 chance that the 2008 recession would be as severe as it turned out to be.
Based on the numbers, Silvers thinks Obama has an edge in the Electoral College, and in his most recent forecast over the weekend he predicts that there are a little less than three chances in four that Obama will win. This is not the same thing as being certain. Silver knows what he doesn’t know, and this should be more reassuring to us than forecasters who use fewer sources of data yet appear more certain.
In the late Nobel laureate Richard Feynman’s appendix to the Rogers Commission report on the Space Shuttle Challenger accident, Feynman’s concluding words were “Nature cannot be fooled.” Feynman would have applauded The Signal and the Noise, for Silver shows in area after area that while experts cannot fool nature, it’s all too easy for them to fool themselves and deceive others. No technical or statistical expertise is needed to appreciate this book. The more you know or think you know, though, the more you will learn about the limits of expertise and the work we must do to minimize unavoidable biases. The Challenger that couldn’t explode followed the Titanic that couldn’t sink. No institution, no theory, no data set is too big to fail.
