![]() As the first Presidential election without the full protection of the Voting Rights Act approaches, boosting voter registration and turnout is the best cure for what ails American democracy.
As the first Presidential election without the full protection of the Voting Rights Act approaches, boosting voter registration and turnout is the best cure for what ails American democracy.
My recent report, Why Voting Matters, shows how voter turnout can dramatically affect policy. Right now, politicians are vying for an electorate that is older, whiter and richer than the general public. They are therefore more likely to ignore the preferences of low-income and non-white people.
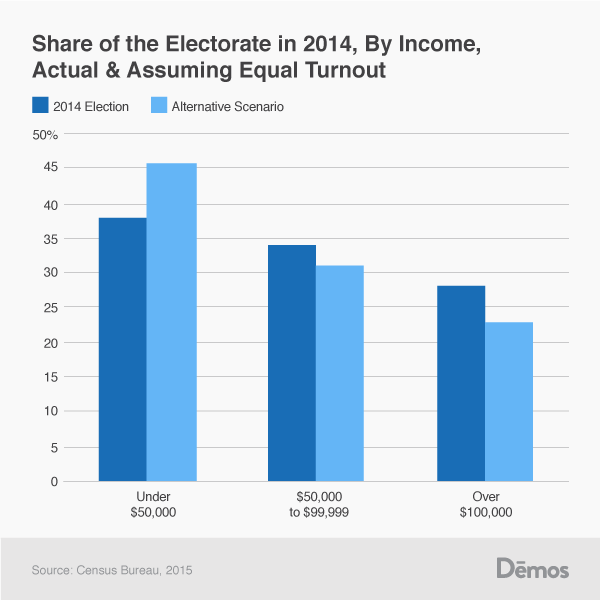
To illustrate this, I examined Census data from the 2014 election and examined how higher turnout among people of color and low-income people would have changed the composition of the electorate in 2014.
First I looked at what would happen if low-income people voted at the same rate as the wealthy. In 2014, 28% of voters earned more than $100,000, if low-income people voted at the same rate as the wealthy, only 23% of the electorate would have made more than $100,000. While this seems small, 5% of the electorate is massive—the difference between the non-Hispanic white share of the electorate in 2000 and 2012 was 7 points. People in families earning less than $50,000 made up 38% of the electorate in 2014—in an equal turnout scenario, they would have made up 46% of the electorate. Non-Hispanic whites made up 76.3% of the electorate in 2014, with equal turnout they would have made up 69.9% of voters.
When examining even a smaller elite, the gaps are larger. Take non-Hispanic whites in families with an income greater than $75,000. While this group makes up a bit more than a quarter of people in the United States (27%), they make up more than a third of voters (35%). And while non-white individuals in families earning less than $50,000 make up 16% of individuals in America, they are only 11% of voters.
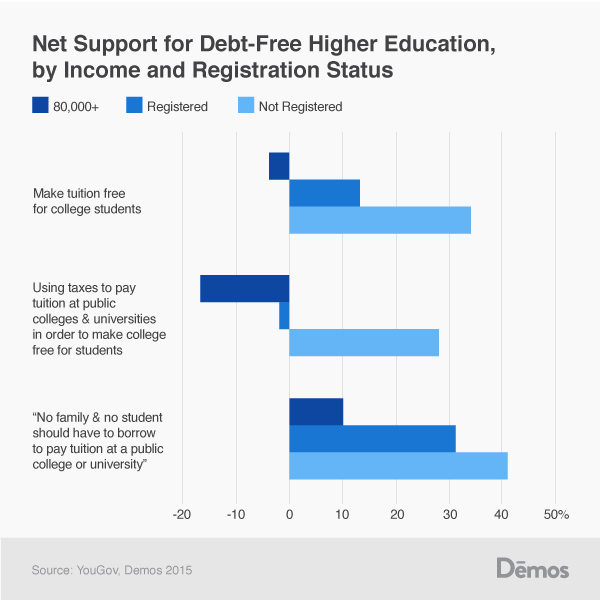
This can have a dramatic impact on policy. Take an issue that’s heating up as the 2016 election comes up: debt-free college. YouGov recently performed a survey of American attitudes on the subject. Their assistant editor Peter Moore was kind enough to make their data on opinions broken down by registration status available to me.
Non-registered Americans were more likely to say they were “not sure” on the five questions I examined (7% average across the questions for registered, compared with 25% for non-registered), the non-registered Americans who expressed a preference were far more likely to offer the progressive option.* I also compared registered and non-registered to the preferences of high-income families (those with a family income of $80,000, in this poll). As the chart shows, these wealthy individuals were the least likely to support the progressive option.
It’s also hard to deny that these are issues that non-registered individuals don’t care about. Indeed, on all three questions, non-registered Americans were more likely to agree “strongly” with the progressive option, and far less likely to disagree “strongly.” YouGov also asked about whether the state and federal governments spent enough on college. As Demos has extensively documented, the rising cost of college can be directly attributed to the “Great Cost Shift” from state governments paying for college to students.
Both registered and non-registered Americans strongly agree the government should do more, both state and federal, with only 2% of non-registered Americans saying the federal government did “too much” to “help students afford earning a college degree” and just 4% of saying state governments did too much.
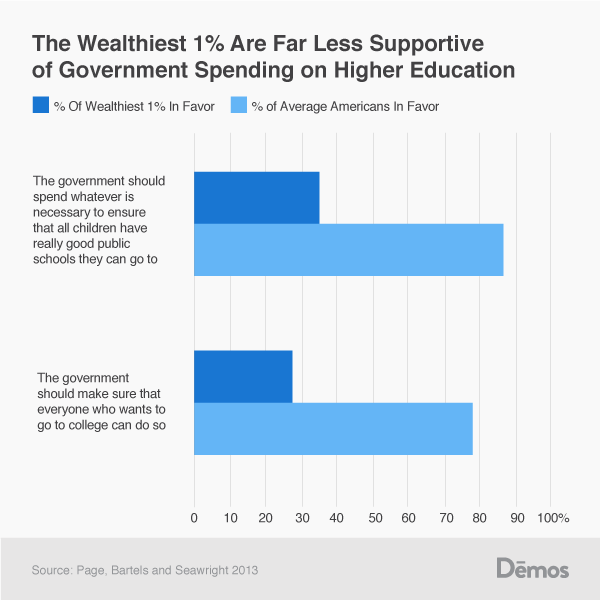
Studies of the most elite individuals suggest they would likely oppose debt-free higher education. In a study of the wealthy carried out by Benjamin Page, Larry Bartels and Jason Seawright, the authors find that the wealthiest Americans are far more opposed to government spending on higher education.
This is worrying because studies suggest policymakers are more likely to respond to the preferences of donors, and those donors are overwhelmingly incredibly rich.
Cooperative Congressional Election Study data indicate that 24% of Americans gave money in the 2012 election cycle, but only 6 percent gave more than $200. On average, the general public gave $336 and the richest 100 billionaires gave $74,982. That means that the average donation by one of the super rich is 223 times more than the donation of the general public.
Unsurprisingly, given other research, billionaires heavily favored the Republicans: 65 percent of those who made partisan contributions were exclusively or primarily to Republicans. On average, each billionaire in the sample gave $53,227 to a Republican candidate and $21,411 to Democrats.
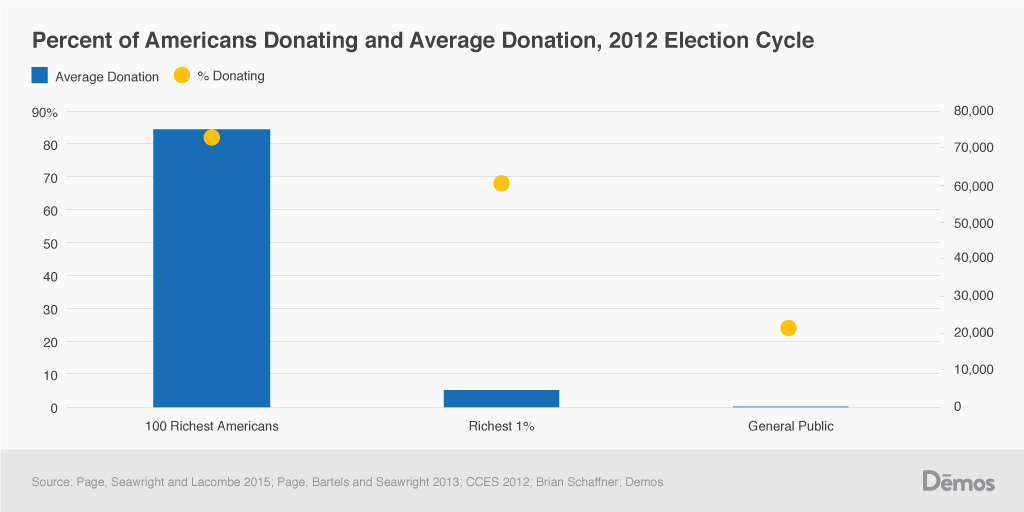
This chart uses uses data from Brian Schaffner, a professor of political science at University of Massachusetts-Amherst and one of the lead researchers on the Cooperative Congressional Election Study (a massive survey that includes 50,000 respondents) as well as two studies by Benjamin Page to compare donations from the general public, the 1% and the richest 100 billionaires.
Voter registration is an important part of the problem, and elsewhere I’ve outlined other sources (for example, mobilization bias). To bolster registration, the U.S. needs three reforms. First, automatic voter registration, which shifts the burden of registration from individuals to governments should be implemented where possible. Second, stategovernments need to pursue robust enforcement of the National Voter Registration Act. Third, all states should pass Same-Day Registration for those who slip through these two programs.
Bolstering registration will make it far more easy to mobilize voters during both the early voting period and on election day. This National Voter Registration Day, voting is more necessary than ever to combat the increasing power of money in politics.
* I examined net preferences by subtracting the share of individuals opposed to the statement from the share in support. On the first three questions examined, YouGov had five categories: Favor/Oppose Strongly and Favor/Oppose Somewhat. I collapsed into two categories (Favor/Oppose).
