
If you’re reading this, you’re likely a lot poorer than you think.
Many people have felt that way over the past three years because of the unusually high overall inflation the nation has experienced. But the real reason you’re poor has very little to do with the prices of the past three years — and everything to do with the prices of the past 30 years. This is inflation that we were told, for the most part, had been kept low and steady. Much of this period is made up of the “Great Moderation,” as economists call it, a period when no matter what else happened in the country or the rest of the world, overall inflation never seemed to deviate much from the 2% target that the Fed has revered for so long.
It's a fantastic story. A triumph of policy intersecting with markets. The zenith of economic mastery. And the best possible outcome for Americans at all levels.
Too bad the story isn’t true.
Oh, the headline inflation numbers were technically correct; that’s not the issue here. It’s the “triumph” part. The “zenith.” The idea that the Great Moderation was actually great, or, for that matter, moderate. And most importantly, the suggestion that this — the economy we’ve landed in after all that time — is what was best for Americans.
In reality, inflation in the U.S. has been unofficially split into two major categories for decades: the things we want, and the things we need. Due in large part to globalization and offshoring, the prices of the things we want — electronics, household appliances, off-the-rack designer clothing and so forth — have generally increased slowly, or even gone down. Meanwhile, the costs of the things we need, like shelter or medical care — the kinds of things that can’t be offshored and for which demand can’t fall to any substantial extent — have risen faster than general inflation year after year after year. At any single moment in time, this is not particularly major news, which is why the topic has garnered relatively little attention. “Medical Bills Expanded Somewhat Faster Than Broad Consumer Prices In 1995” isn’t much of a headline. But when the same thing happens over and over again, the burgeoning buildup of the resulting imbalances can completely reshape an economy, even the largest economy the world has ever seen.
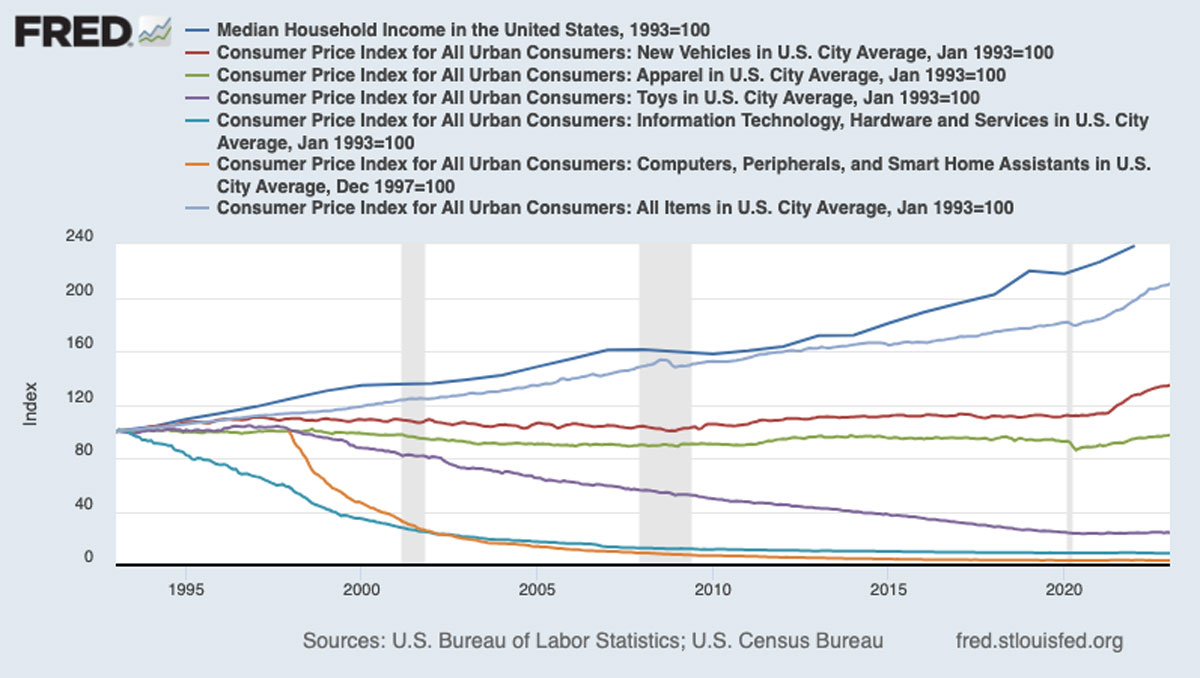
To set the stage for this retelling of history, it helps to know that overall inflation between 1993 and 2023 totaled 110%. Keep that number in mind, because most of the ones that follow won’t be anywhere close to it.
Prices of the things we want — electronics, household appliances, off-the-rack designer clothing — have increased slowly, or even gone down. But costs of the things we need, like shelter or medical care, have risen faster than general inflation year after year after year.
Take new cars, for example. While a certain bare minimum of new vehicles must be produced every year in order to replace those that have permanently broken down or been destroyed, the vast majority of new car purchases are not only completely unnecessary, but have been called the single “worst investment” a person can make by a range of sources from Suze Orman to CNBC and even Cadillac’s own customer message board. A new car is a want, not a need. And luckily for those who have fulfilled this particular wish, the cost of a new car went up by just 34% between 1993 and 2023. In fact, until the recent spurt of widespread inflation that started in 2021, the average price had only gone up by 11% over the preceding 28 years.
Then there’s apparel. Again, nobody would dispute the fact that a certain quantity of clothing is essential — but that doesn’t change the fact that a vast number of U.S. purchases are superfluous. The EPA estimates that Americans throw away more than 17 million tons, or 34 billion pounds, of textiles every year. That’s more than 100 pounds for every man, woman and child living in the country. Every. Single. Year. Those 100 pounds have to be replaced by something, namely buying more outfits that we wear less often. Yet even such a powerful “want” has failed to keep up with increasing supply and decreasing manufacturing costs, as the overall price of clothing has jumped very little in the past 30 years; in fact, despite the recent spike, the average cost has actually decreased by 2.5% since 1993.
That dip is nothing compared to the same measurement for children’s toys, which have plummeted in price by a whopping 76% during the timeframe in question. But the big kahuna of consumer deflation is electronics. In three decades, the cost of IT hardware (as a broad category) and services has fallen by 91%. The more specific category of personal computers, smart home assistants and “peripheral” equipment has only been tracked by the BLS since 1997, but in that time, the measure has fallen off a cliff, to the tune of 97%. TVs have gone right over that same cliff, just beating out computers by crashing more than 98%.
 (U.S. Bureau of Labor Statistics/U.S. Census Bureau)
(At this point, there surely must be an army of naysayers asking, “How have televisions gotten that much cheaper when my curved, foldable, voice-activated, 90-inch Megatron 17K Code Red Plutonium-Plasma HHHHD Doritos Locos Extreme 5000 smart TV still cost me $799?” Well, the BLS evaluates improvements across all products and services over time, and factors those improvements into the actual values that consumers are getting for the same basic type of product. Just as today’s smartphones have tens of thousands of times more computing power than the Apollo 11 spacecraft while costing millions of times less, these drastic changes are taken into account just as much as the number on the store tag.)
So far, this seems like excellent news. While countless articles have been written about the slow long-term growth of wages, median household income has still outpaced inflation since 1993, pushing upward by 138%. Earnings are up, and plenty of prices are down. Despite what the celebrated economist Mick Jagger said, it would appear that we can, in fact, get what we want.
The problem is getting what we need.
Anyone who’s bought eggs since the COVID lockdowns began four years ago might suspect that everyday necessities like groceries and gasoline are the main drivers of new poverty. But over the long term, such items keep pace with the growth of personal income surprisingly well (albeit with more volatility, in the case of fuel) in a functional economy, and don’t alter its fundamental structure — although it’s clearly true that spikes in those prices are the most likely to cause widespread anger among consumers. (To quote John Schoen of NBC News, “As anyone who drives a car is painfully aware, few other products require that you stand and stare at the price, in giant lettering, for several minutes.”)
No, the needs that have changed American life amount to a four-headed monster that has been fed by a perversion of market forces. For these sectors of the economy, the basic relationship between producer supply and consumer demand simply doesn’t exist in the same way it does for cars, computers or one brand of peanut butter to another.
The needs that have changed American life amount to a four-headed monster that has been fed by a perversion of market forces.
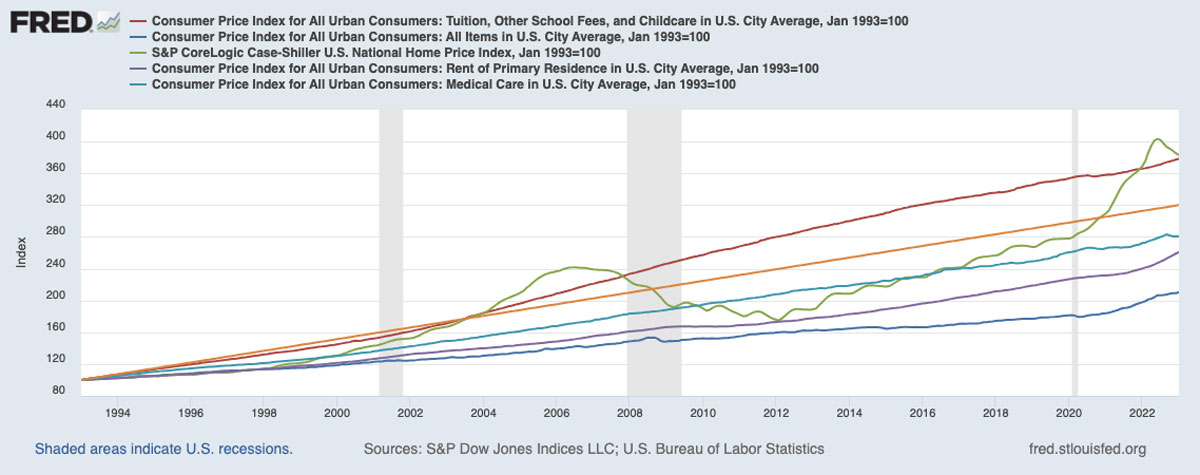
The first head is housing, where prices have repeatedly shattered all-time highs just a decade and a half after crashing from their previous all-time highs and sparking the worst financial crisis since the Great Depression. The benchmark Case-Shiller Index has risen by 306% since 1993, including a nearly-70% leap from the pre-crisis peak in 2006, a statistic made all the more astonishing (or, for aspiring home buyers, devastating) by the fact that 30-year mortgage rates hit their 21st-century high last October. Things are, of course, at their worst in places like San Francisco, where the annual income needed to buy a median-priced home is more than $400,000 and the median monthly mortgage payment is over $10,000. But it’s not just the biggest, most expensive cities where people feel this problem; according to property data publisher ATTOM, home ownership is now considered “unaffordable” (defined as eating up more than 28% of the local median income) in roughly 80% of counties across the country.
Much of this reflects the drastic undersupply of housing that exists all over the US because of local zoning laws, HOAs and NIMBYism. But it also has to do with the permanent bureaucratic decision across both parties, multiple presidential administrations and all ideologies that the federal government must use its financial might to “promote homeownership” — which is just another way of saying “boost demand.” So as prices went up, it was deemed necessary that mortgage debt must become cheaper and easier to access, which made prices go up further, which required debt to become even cheaper and easier, and so on.
We need your help to stay independent
The road to hell, as they say, is paved with good intentions. And in a vacuum, expanding homeownership — especially by eliminating racial redlining and other discriminatory practices — is an excellent intention. However, we all know the story leading up to 2008, and how it turned out. The policies were successful. Enormously successful. As it turned out, given the spread of things like “NINJA” (No Income, No Job or Assets) loans and financial products with names such as “unfunded synthetic mortgage-backed securities,” much too successful. Homeownership peaked in 2004, followed by housing prices in 2006, at what were records for each measure at the time. They hovered in place for a bit longer until the bottom fell out.
A couple of things happened after that. One, the largest financial bailouts in U.S. history made it clear that the government would do anything to stop a collapse of the housing market. Two, the feds went to the same people who were being bailed out, the same people who invented NINJA loans and unfunded synthetic mortgage-backed securities and other kinds of inscrutable financial garbage — Wall Street — and asked them for help. In the ashes of the crisis, Fannie Mae launched a 2012 pilot program allowing investment funds to buy up swathes of homes that were sitting empty after foreclosures. This effort proved exceptionally popular and was expanded repeatedly, providing the necessary demand to drive housing prices skyward once again even as individual homeownership has fallen from that 2004 peak of 69% to 65%, which is where it was in 1997.
Today, Blackstone, the largest private equity manager in the world, is also America’s largest landlord. In some metro areas, such as Atlanta, institutional investors own the outright majority of homes in some neighborhoods, and just three companies own 11% of all rental homes in the entire state of Georgia. These large-scale purchases are concentrated on specific areas of the country, like the Sun Belt. It just so happens that rental prices in the Sun Belt have jumped by nearly twice as much as the national average over the past few years.
Blackstone, the largest private equity manager in the world, is also America’s largest landlord. Just three companies own 11% of all rental homes in the entire state of Georgia.
These investment funds would say that their share of the overall rental market in the entire country is still small, which is true: they own about 5% of the entire national sum of single-family rental homes right now. But they’re buying more of them at a furious pace, with MetLife projecting that the same firms could own almost half the total stock of such homes by 2030. This trend, combined with the fact that with the broader shift of millions of people from homeownership back to renting, has thrown a giant monkey wrench into what would be the natural market reaction to astronomical housing prices: Don’t buy, rent. Well, average rents across the country (including multi-family units) have soared by 50% since 2012, while personal income has increased by 46%. That doesn’t seem like a catastrophic mismatch, but the problem is that buying a house has become radically expensive, while renting a house has become slightly more expensive at the same time. What else are people supposed to do?
 Former New York gubernatorial candidate Jimmy McMillan was right: The rent is too damn high. Unfortunately, housing prices are even higher. (Audrey C. Tiernan-Pool/Getty Images)
The story is similar in the world of education, primarily driven by colleges and universities, which make up a larger portion of the BLS measurement than all other levels of schooling combined. This broad-based figure has grown by a mammoth 278% in 30 years, with university tuition dragging that figure upward, surging by 305%. By sheer lack of coincidence, only college and post-graduate education can be funded by what is effectively an unlimited form of personal debt, which is more difficult to discharge in bankruptcy than virtually any other type of debt.
Again, as with home ownership, this is not to say that the goal of higher education is misguided. It’s the way we’ve decided to pay for it that’s the issue. “Student loan programs began with altruistic intent,” Hope College president Matthew Scogin told USA Today last October. “There was a problem, though. With no limits on the amount students could borrow, colleges and universities had a clear path to raise the sticker price of tuition year after year. After doling out all available aid, colleges simply directed students to federal loan programs to close any funding gaps — however big.”
While the federal government had guaranteed a small volume of loans made by educational institutions since 1958, then guaranteed all student loans made by private lenders since 1965, and has outright purchased a certain quantity of such loans since 1972, this system amounted to relying upon thousands of middlemen with limited resources and differing standards. Washington began the process of dispensing with such middlemen and funding loans directly, with no merit- or needs-based qualifications of any kind, in a wildly convenient year for the purposes of this article: 1993. Under the Student Loan Reform Act of 1993, the total amount of money that graduates owed straight to Uncle Sam went from the obvious starting point of zero to $1.62 trillion in 2023. Adding in the small amount of privately-funded student loans that still exist, the total came to $1.77 trillion, easily eclipsing the $1.03 trillion of credit card debt on the books at the time.
Nonprofit Quarterly writer Steve Dubb came to a straightforward conclusion when writing about how bad the student debt problem was five years ago: “It’s a simple lesson — if you subsidize demand but don’t have sufficient supply, the price goes up… US higher education spending now is highest in the world (except Luxembourg) — about $30,000 a student.” In his commentary, Dubb cited one of the original architects of federal student loans, economist Alice Rivlin, and her opinion on the project she pushed so hard for in her younger days. With those efforts, she said, “We unleashed a monster.”
Once again, the private equity industry spotted the above trends and determined that a major stream of revenue was ripe for the picking. UC Berkeley professor Charlie Eaton studied the purchases of nearly 1,000 educational institutions and the resulting effects. While tuition and student borrowing increased more quickly per year than at comparable educational institutions not subject to that type of ownership, Eaton found “sharp declines” in “student graduation rates, loan repayment rates, and labor market earnings after private equity buyouts.” But even as academic budgets were generally cut across the board, increased recruiting budgets meant that there were always new students in the pipeline, and the data from these thousand schools suggest that “profits triple after a buyout.”
Want a daily wrap-up of all the news and commentary Salon has to offer? Subscribe to our morning newsletter, Crash Course.
Private equity, Eaton concluded, just “leads to better capture of government aid” than other forms of ownership.
A similar analysis also applies to the many areas of health care into which private equity has injected itself, notably specialist fields, in which single firms often own more than half the practices of various specialties in entire cities, and senior care facilities or nursing homes, where you — yes, you! — can buy shares in nursing-home real estate funds, which have been nauseatingly described as “the surprise heroes of high-yield investing.” But the health business as a whole and the reasons for its exploding costs are infinitely more complicated than those found in virtually any other sector. Suffice it to say, the United States has conclusively proven that a Frankenstein’s monster of health “consumers” (a misuse of the word if there ever was one) who have no idea what their “purchases” will actually cost, profit-driven private insurance companies that pay different amounts to different providers for identical care, a random mix of public and private providers who all charge different amounts to different consumers for the same care, a regulatory apparatus that has been completely captured by the pharmaceutical and medical device industries that the apparatus is supposed to be regulating, and a giant flow of government money undergirding the whole system… does not work.
You — yes, you! — can buy shares in nursing-home real estate funds, which have been nauseatingly described as “the surprise heroes of high-yield investing.”
As the country has stumbled its way through decade after decade of proving just how much this assemblage of throwaway parts from a grab bag of differing health care philosophies doesn’t work, the share of the economy taken up by health care spending has grown to more than 17%, or roughly one-sixth, of our entire GDP, roughly twice the average of OECD nations overall. We spend more per capita by far than any other country on the planet — and yet have the lowest life expectancy, highest death rate for avoidable conditions and highest maternal and infant mortality of any OECD member, not to mention dozens of other statistics that paint just as pathetic a picture. This is not a plea for any specific replacement for the current structure of American health care; it is simply a testimony to how massive a failure that current structure is. And we the people are paying, or even worse, not paying for it — medical bills are the No. 1 cause of personal bankruptcy in the U.S.
Finally, there’s the rapidly accelerating cost of something that non-parents might be blissfully unaware of: child care. The Department of Labor declared in 2023 that, according to its data, paying for child care is “untenable for families across all care types, age groups, and county population sizes.” The cost of care for two children “exceeded the average rent in the District of Columbia and all 49 states with available data.” This is happening with providers consistently losing workers to fast food and big-box stores whose jobs pay better, despite the outlandish prices of child care. Treasury Secretary and former Federal Reserve chair Janet Yellen has noted that care employees only make an average of $27,000 a year, putting them in “the bottom 2% of all occupations.” According to Yellen, “child care is a textbook example of a broken market.”
Unfortunately, there is no single definition of “child care costs,” making it difficult to track exactly how much they have changed over time. Oddly enough, even sources that claim to use the same data from the BLS come up with different numbers, and the BLS itself does not appear to track an isolated “child care” price number every single year. Most sources, however, agree that the inflation-adjusted cost of such care has at least doubled the overall rate of inflation in the past 30 years — some say it is much worse than that, but this article will take the conservative approach and merely apply the doubling statistic.
 (U.S. Bureau of Labor Statistics / S&P Dow Jones Indices LLC)
From those four types of expenses for today’s families — the four fundamental forces of America’s modern-day household sector and the four horsemen of America’s slow-motion economic apocalypse — we can explain why so many people experienced such a hard hit when eggs (those damn eggs) doubled in price, or at the multiple moments when gas prices have shot upward. Most people simply have a smaller percentage of their income to devote to anything other than these “fundamental forces,” despite the fact that real wages (minus COVID stimulus checks) are at an all-time high and the U.S. has the fourth-highest income per capita in the world. In other words, being rich never felt so poor.
Most people simply have a smaller percentage of their income to devote to anything other than these “fundamental forces,” despite the fact that real wages are at an all-time high. Being rich never felt so poor.
The median household earned $31,240 in 1993 (in 1993 dollars) and earned $74,580 in 2022 (in 2022 dollars). If the household had one adult who graduated from college in 1993, the average student debt burden would have been $9,320. In 2023, it was $37,650. If this household bought a, well, house, the median cost in 1993 would have been $125,000; in 2023, it would have been $417,400. If the people of this young household decided to have a child early, the monthly cost of child care in 1993 would have been $323. Three decades later, to use the rough estimate from above, the cost would be $1,036 per month. And even if the members of the household were covered by their parents’ health insurance, they would still pay out-of-pocket costs of $2,854 for childbirth in 2023; the same figure is difficult to pin down for 1993, but since overall costs (insurance payments plus out-of-pocket contributions) have roughly tripled in that time, it’s a reasonable guess that those services would have come in at around $951.
No worries on that last point, however; as William Friedewald, chief medical director for MetLife back in those good ol’ days of 1993, helpfully pointed out, “You can have a delivery in a taxicab, and it’s free.”
Albert Einstein may not have actually made his apocryphal proclamation that compound interest is the most powerful force in the universe, but it wouldn’t take the smartest man of the 20th century to spot the mathematical atomic bomb slowly ticking away when the basic cost of living in a country is compounding faster than the ability to make a living in that same country. And while Einstein may get unmerited credit for that claim, economist Herb Stein deserves real kudos for coining another phrase that could just as well be applied to the same situation: “That which cannot go on forever, won’t.”
This is it: the true story of the modern American economy. It is the saga of the declining costs of indulgence, overwhelmed by the rising costs of necessity. It is the reason why millennials and Zoomers are planning for a world in which material prosperity will not be determined by how much they have, but by how little they owe. It is the sound of statistical inevitability, the sound of the death of the American dream, should these trends continue — eventually, this system will break down.
We can only hope the next one will hit a triumphant zenith that isn’t entirely imaginary.
Read more
about inflation and the economy
